
Padmanaban Krishnan

Wayne Moore
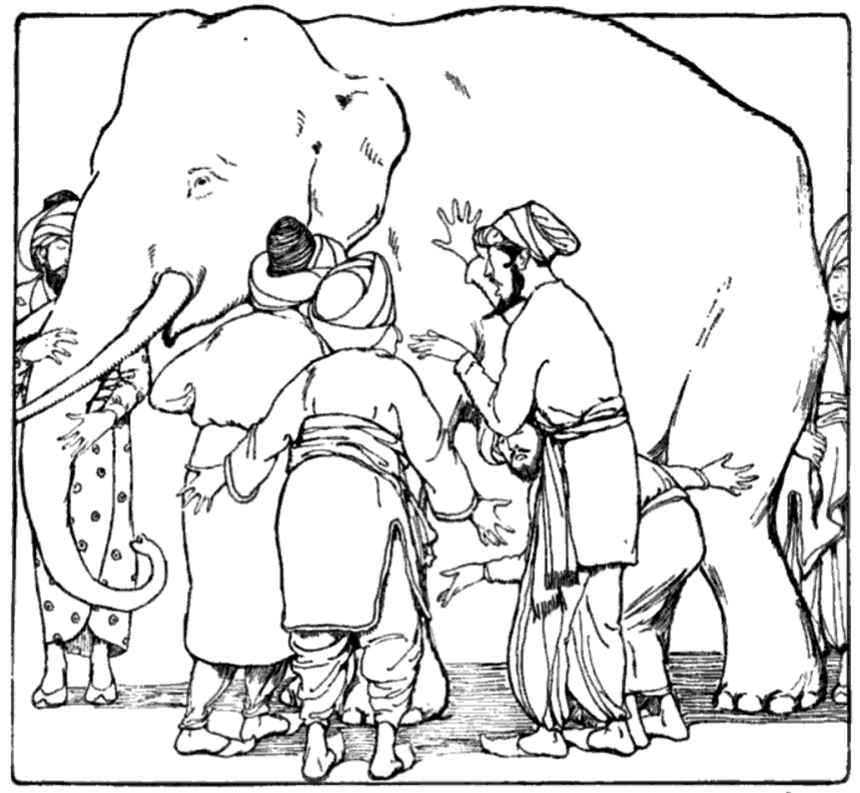 This image is in the public domain. Source: Holton, M. A., and Curry, C. M., Holton-Curry Readers, Rand McNally & Co., Chicago, p. 108, 1914.
 “A group of blind men heard that a strange animal, called an elephant, had been brought to their town. Out of curiosity, they found the elephant and began to touch it to determine what sort of creature it was. The first man found the trunk and said, ‘This being is like a thick snake.’ The man who touched its leg claimed it was a tree-trunk. Feeling its side, one knew it as a wall. ‘No, it’s a rope,’ shouted another. Grabbing the tusk, the last declared ‘You fools, it’s hard and smooth, like a spear.’”
In this parable from India, the blind men describe the elephant based on their partial experience, leading them to distrust and disagree about what an elephant is. The parable reveals how humans have a tendency to project their partial experiences as the whole truth and discount other people’s experiences.
Like the blind men in this parable, analytical scientists sometimes become mired in the minutia of individual data points or complex data sets, yet lose sight of what the data actually means. In both academia and industry, laboratories collect data and generate reports, but they miss other relevant factors and are lulled into a false sense of accuracy. For example, a lab that acquired a new instrument began generating data to multiple decimal points, believing that the decimal points signaled precision. But, the instrument was not calibrated properly: precision does not equal truth.
This issue of Cereal Foods World presents a collection of articles that explore the theme of “seeking truth in data” from a few different angles. As a director of quality, these articles will help you design and manage quality control systems that are informed—not derailed—by analytical data. Cereal scientists who only peripherally touch on analytical issues will benefit from how these articles inspire different approaches when interpreting data related to their own work.
Hare explores how the data reported by an analytical lab is only as good as the capabilities of the lab. If a lab does not have adequate controls, then their results may be questioned. Some useful techniques are offered to help labs improve their performance using appropriate statistical methods for evaluating performance. He also urges plotting of data to enhance interpretation and communication of data.
Bettge shares a case study in which the price of wheat was affected by flawed interpretation of laboratory data. Grain prices to growers were discounted because of low falling numbers, despite the fact that the particular measurement is not a precise indicator of enzyme activity. Too much reliance on a method applied beyond its intended scope can have real-world consequences. Analytical scientists might focus on educating uninitiated readers and nontechnical business partners on how to extract meaning from their lab data.
Near-infrared spectroscopy (NIRS) has been used to measure moisture and protein of grains for many years, and more recently, calibrations for other constituents have come into practice. Krishnan has expanded the use of NIRS measurements to overlay spectra data on top of other analytics, which unveils a more holistic picture that includes β-glucan, amino acids, and fatty acids—you can touch more parts of the elephant.
From Szpylka’s article, we learn how new technologies with increased sensitivities can measure contaminants at ever-lower levels. However, we must be cautious when interpreting results of analyses that show very low levels and understand the significance of these results.
This issue also includes three application articles that offer practical guidance. As a practicing statistician, Nelsen advises on how to design an experimentation plan rather than jumping into data collection and analysis. Without a clear objective and plan, you will be left at the back end asking, “What do I do with these data and what does it mean?” DeVault provides guidance on environmental testing for microbial and allergen food safety testing and addresses laboratory/plant food safety requirements. Guilfoyle presents a practical approach with “how to” steps for data analysis, including use of software.
Because many companies use external labs for specialized, or even routine, analyses, Stier explores the perennial topic of how to select an outside laboratory.
As you peruse this issue of Cereal Foods World, keep Ockham’s razor in mind: among competing hypotheses, the one with the fewest assumptions should be selected.