|
|
04 Technical Reports
Cereal Foods World, Vol. 64, No. 5
DOI: https://doi.org/10.1094/CFW-64-5-0058
Print To PDF
DisplayTitle AACC Approved Methods Technical Committee Report: Crack Resistance and Translucency Determination of Paddy Rice Kernels Using the PaddyCheck Instrument
Authors J. K. Purhagen,1,2 J. Fjällstöm,3 and M. L. Bason4
Affiliations 1 Food Technology, LTH, Chemical Centre, PO Box 124, SE-221 00, Lund, Sweden.
2 Corresponding author. Tel: +46 46 222 83 05; E-mail: jeanette.purhagen@food.lth.se
3 Perten Instruments AB, PO Box 9006, SE-129 09, Hägersten, Sweden.
4 Perten Instruments Australia, PO Box 70, North Ryde, BC 1670, Australia.
© 2019 AACC International, Inc.
Abstract
CFWAbstract Physical properties such as break resistance, chalkiness, and size dimensions are very important for grading rice quality. Today, most of the methods used for determining these properties are performed manually, making them both time-consuming and, to some extent, subjective, which, in turn, can affect the determination of rice quality and, thereby, the price. A collaborative study was conducted by the Rice Milling and Quality Technical Committee in 2017 to assess the performance of a new method that combines imaging and texture methods to determine the crack resistance and translucence of rice kernels in paddy form. Ten laboratories analyzed twelve different varieties of paddy (rough) rice using PaddyCheck instruments (Perten Instruments). The PaddyCheck method clearly distinguished between the samples in terms of their crack resistance and translucence. Repeatability standard deviations within laboratories were <3.1% for crack resistance and <5.0% for translucency for all samples, and reproducibility standard deviations between laboratories were <5.1% for crack resistance and <8.5% for translucency. The PaddyCheck method has been approved as AACC Method 61-10.01.
Trying to reach content?
View Full Article
if you don't have access, become a member
Page Content 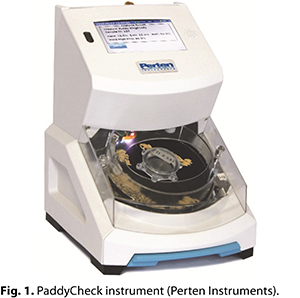 Today, head rice yield (HRY), which is an indicator of the economic value of harvested grains, is a determining factor in the market grade of rice (11). Head rice may be worth twice as much as broken rice because end users are willing to pay a premium price for whole kernels (6). HRY is defined as the mass percentage of the paddy (rough) rice that maintains at least three-fourths of its original length during milling (i.e., hull, bran, and germ removal) (11,13). Breeders, producers, and millers aim for a high HRY to produce quality products for consumers and to increase profitability. There is a market need to be able to measure the HRY, or obtain a corresponding measurement, of rice in a faster and more accurate way. One possible alternative is to measure the crack resistance of the rice kernel in paddy or brown rice by applying a preset strain to it and measuring the stress response (12). Today, head rice yield (HRY), which is an indicator of the economic value of harvested grains, is a determining factor in the market grade of rice (11). Head rice may be worth twice as much as broken rice because end users are willing to pay a premium price for whole kernels (6). HRY is defined as the mass percentage of the paddy (rough) rice that maintains at least three-fourths of its original length during milling (i.e., hull, bran, and germ removal) (11,13). Breeders, producers, and millers aim for a high HRY to produce quality products for consumers and to increase profitability. There is a market need to be able to measure the HRY, or obtain a corresponding measurement, of rice in a faster and more accurate way. One possible alternative is to measure the crack resistance of the rice kernel in paddy or brown rice by applying a preset strain to it and measuring the stress response (12).
Chalkiness, another key determinant of rice market value, occurs due to the scattering of light by air spaces in loosely packed starchy endosperm (3), where nominally at least half of the kernel is opaque white. Variety and growth environment both affect the prevalence of chalkiness, which is associated with softer kernels and reduced HRY (15). With the exception of Arborio rice, tight limits are set on the proportion of chalky kernels permitted in long and medium rice grades for trade (11). Chalkiness is usually measured visually in rice after milling and polishing, but its measurement can be both automated and applied to paddy rice by measuring the attenuation of transmitted light (12).
 The PaddyCheck instrument (Perten Instruments) (Fig. 1) was developed to provide a simple, objective, and fast evaluation of the physical properties of paddy rice kernels (12). The advantage of using paddy rice for testing kernel characteristics is that there is no need to dehull or mill the samples, making the method especially useful for high-throughput users such as breeders and traders. The PaddyCheck instrument (Perten Instruments) (Fig. 1) was developed to provide a simple, objective, and fast evaluation of the physical properties of paddy rice kernels (12). The advantage of using paddy rice for testing kernel characteristics is that there is no need to dehull or mill the samples, making the method especially useful for high-throughput users such as breeders and traders.
Crack resistance is measured by a three-point bend, texture measurement at a given force, and translucency is measured by polarized light transmission. Singulation discs with different cavity sizes are chosen to match the kernel size in a sample. These rotate to select and then present each kernel to imaging and texture measurement systems. A camera is used to correctly position the kernel before measuring its texture, while a second camera captures and records the light transmitted through it. The length and width of the kernels are also calculated from these images but are not reported in this study.
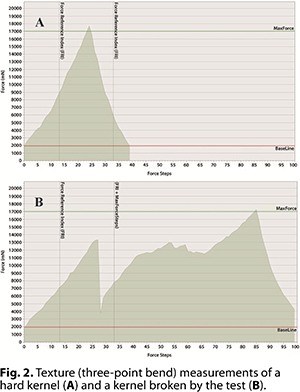
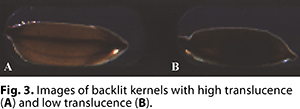
The texture method provides a measurement of the proportion of kernels in a sample that can withstand a specific normal force of 17 N without breaking, defined here as Hard (%), while the translucency measurement provides a measurement of the proportion of polarized light that passes through these kernels,
defined here as Hard High Perten Translucency Unit (Hard High PTU) (%). A high translucency value corresponds to a glassy kernel, which indicates a sound kernel. Examples of texture measurement curves and translucency images are shown in Figures 2 and 3, respectively.
The aim of this study was to assess the discrimination power and precision of a new method for measuring the crack resistance and translucence of indica and japonica paddy rice types using the PaddyCheck instrument, following the AOAC guidelines for collaborative study procedures (2).
Collaborative Study
 Collaborators. Ten collaborators were selected to represent typical users, including rice research centers, institutes, and breeders; universities; and R&D facilities. The collaborators, based in China, France, Italy, Spain, Sweden, and Thailand, were provided with the necessary PaddyCheck instrumentation and training and did not receive any compensation for their participation. Collaborators. Ten collaborators were selected to represent typical users, including rice research centers, institutes, and breeders; universities; and R&D facilities. The collaborators, based in China, France, Italy, Spain, Sweden, and Thailand, were provided with the necessary PaddyCheck instrumentation and training and did not receive any compensation for their participation.
Samples. One practice sample and twelve different varieties of paddy rice were used. Six of the samples were indica varieties, and six were japonica; the samples were sourced from Hainan, Sichuan, LiaoNing, and HeiLongjiang provinces in China. The kernel lengths were between 6.1 and 8.7 mm. For two of the varieties, blind duplicates were added, which provided fourteen samples to analyze. Each sample contained between 400 and 800 kernels that had been predivided using the Sequential Precision Divider (SPD 4200, Perten Instruments) to ensure homogeneity between the distributed subsamples (4,12). All kernels in each sample were measured, and the raw data from the instrument were collected and split into two groups, odd and even: the first, third, fifth,… kernels were placed in the odd group, and the second, fourth, sixth,… kernels were placed in the even group. Thereafter, crack resistance and translucency were calculated for the groups, allowing calculation of within as well as between laboratory precision statistics.
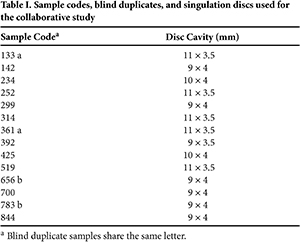 Instruments. The samples were analyzed using a separate PaddyCheck instrument at each facility. Each instrument was equipped with singulation discs that were selected to match the length and width of the samples (Table I). Camera spatial resolution for imaging was 0.1 mm. A test method, allowing the instrument to run until all kernels in a sample were measured, was preloaded and used for the tests. Collaborators ran the practice sample prior to the analyses and sent in the results as a calibration and performance check. One instrument displayed too large an error for the translucency results, and subsequent translucency measurements from that instrument were excluded based on the results of a laboratory-ranking test. Instruments. The samples were analyzed using a separate PaddyCheck instrument at each facility. Each instrument was equipped with singulation discs that were selected to match the length and width of the samples (Table I). Camera spatial resolution for imaging was 0.1 mm. A test method, allowing the instrument to run until all kernels in a sample were measured, was preloaded and used for the tests. Collaborators ran the practice sample prior to the analyses and sent in the results as a calibration and performance check. One instrument displayed too large an error for the translucency results, and subsequent translucency measurements from that instrument were excluded based on the results of a laboratory-ranking test.
Method. Collaborators in the ring study were asked to insert the preselected singulation discs before running the samples (Table I). The discs were chosen to fit the size dimensions (length and width) of the kernels in each sample. The normal force used for texture measurement was 17 N, the test speed was 1 mm/sec, and the instrument firmware version was 0.5.77. All kernels from all samples were run. After completing the measurement of each sample, results displayed on the instrument touch screen were manually recorded, while the raw data for each sample were saved to separate folders on a USB flash drive. Crack resistance is denoted as “Hard” in the software, while translucency is denoted as “Hard High PTU.” Upon completion of testing, the collaborators collated and submitted the results to the study director for analysis.
Statistical Analysis. Data were analyzed according to the AOAC guidelines for collaborative study procedures (2) using templates provided by AACCI—Cereals & Grains Association (Microsoft Excel worksheet). The following analyses were performed:
- Laboratory-ranking test to remove laboratories whose sums of ranked sample results significantly differed from the bulk of the laboratories.
- Cochran outlier test (one-tail; P = 2.5%) to identify and remove any laboratory results with critical values exceeding the acceptable tabular value for the used numbers of laboratories and replicates (8).
- Single and double Grubbs outlier tests (one-tail; P = 1.25%) to identify and remove any laboratory results for which the highest and second highest or lowest and second lowest mean values differed significantly from the remaining laboratories (10).
- Analysis of variance (ANOVA) to compare all sample and blind duplicate means, to calculate repeatability standard deviations (Sr) and repeatability relative standard deviations (RSDr) for repeatability within laboratories, and to calculate reproducibility standard deviations (SR), and reproducibility relative standard deviations (RSDR) for reproducibility between laboratories. The ratio of the range of results to their pooled error standard deviation for each measurement type was calculated as a measure of the ability of the method to discriminate between samples.
 Results and Discussion Results and Discussion
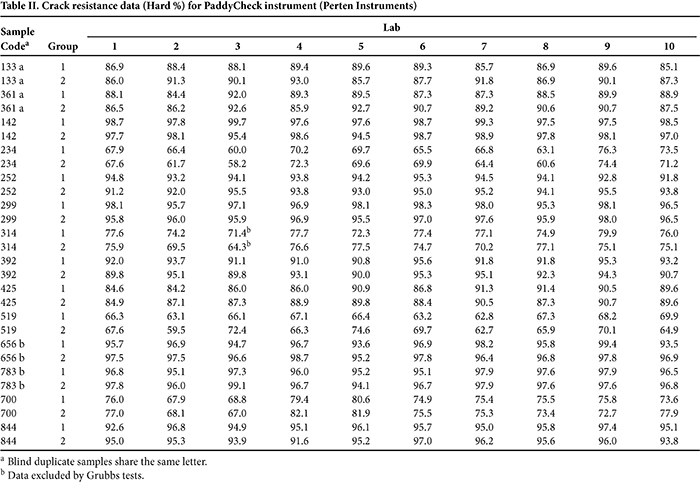
Crack resistance (Hard) and translucency (Hard High PTU) data are provided in Tables II and III, respectively. Cochran and single and double Grubbs analyses of the crack resistance data identified sample 314 from laboratory 3 as an outlier; thus, this value was removed from subsequent analysis by ANOVA. No further outliers conformed with the AOAC limit (2).
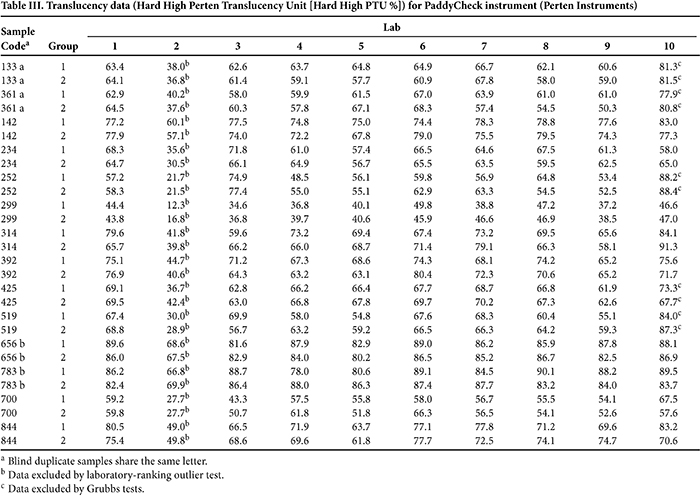
The laboratory-ranking test identified the translucency values for the practice sample from laboratory 2 as being out of range. The polarized camera in this instrument was out of position, and therefore, subsequent translucency data from this instrument were removed from further analysis. The Cochran and single and double Grubbs analyses of the translucency data identified samples 252 from laboratory 3 and samples 133, 361, 252, 425, and 519 from laboratory 10 as outliers; these values, with the exception of sample 252 from laboratory 3, were removed to conform to the maximum removal of two outliers specified by the AOAC procedure (2).
 Crack resistance values ranged from 58.2 to 99.7%, and translucency values ranged from 34.6 to 91.3%, with ANOVA showing the method significantly distinguished between the samples on both measures (P < 0.001). Within this set, the blind duplicates (samples 133 and 361 and samples 656 and 783) did not differ significantly (P = 0.05) for either measure. The ratio of the range over the pooled error standard deviation, a measure of the method’s discrimination power and analogous to the range error ratio used to indicate near-infrared model quality (1), was 16.0 for crack resistance and 11.3 for translucency. Crack resistance values ranged from 58.2 to 99.7%, and translucency values ranged from 34.6 to 91.3%, with ANOVA showing the method significantly distinguished between the samples on both measures (P < 0.001). Within this set, the blind duplicates (samples 133 and 361 and samples 656 and 783) did not differ significantly (P = 0.05) for either measure. The ratio of the range over the pooled error standard deviation, a measure of the method’s discrimination power and analogous to the range error ratio used to indicate near-infrared model quality (1), was 16.0 for crack resistance and 11.3 for translucency.
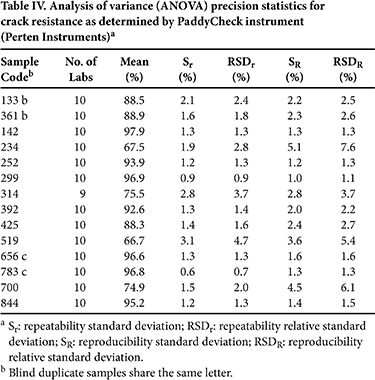
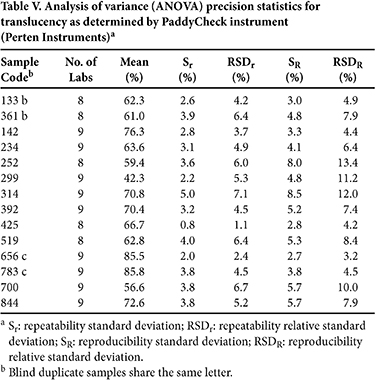
ANOVA precision statistics for crack resistance and translucency are provided in Tables IV and V, respectively. Sr was <3.1% for crack resistance and <5.0% for translucency for all samples, with a corresponding RSDr of <4.7% and <7.1%, respectively. SR was <5.1% for crack resistance and <8.5% for translucency, with a corresponding RSDR of <7.6 and <13.4%, respectively.
There are no prior approved methods for measuring crack resistance and translucence in rice. Initial quantitative comparisons with the related measures of HRY and chalkiness show that the relationship is complex, and this will be the subject of future studies. The precision of the crack resistance measurement reported here is similar to that reported for determination of HRY in paddy rice using ISO standard 6646:2011, in which the critical RSDR values ranged from 1.9 to 9.7% for polished rice (9). There are no reported internationally approved methods or collaborative studies for measuring chalkiness in rice, and in fact, any published data on the precision of measurement of chalkiness is scarce. Comparisons are confounded further by the different grading methods used by different countries: for example, the use of percent kernel count in the United States (7) and percent projected kernel area in China (14) to report degree of chalkiness. Results recalculated from Birla and Chauhan (5) give relative repeatability errors of 18.4 and 21.3% for human and machine (image analysis) determination of chalkiness, respectively, to which the current study compares favorably, notwithstanding the challenge of measuring translucence through the husk and bran.
Conclusions
The method evaluated in this collaborative study was able to distinguish between paddy rice samples in terms of the proportion of kernels that withstood a normal force from a three-point bend texture measurement without breaking (crack resistance) and the proportion of light that went through them (translucence). Based on these results, the PaddyCheck method is suitable for evaluating the physical properties of paddy rice and has been approved as AACC Method 61-10.01.
Acknowledgments
We would like to thank those who participated in this study: Jinsong Bao, Institute of Nuclear Agricultural Science, Zhejiang University, China; Xianqiao Hu, China National Rice Research Institute (CNRRI), China; Yong Ni, Perten Instruments, China; Hui Sun, Academy of State Administration of Grain, China; Cyrille Thomas, Centre Français du Riz, France; Stefano Ravaglia, Societá Italia Sementi, Italy; Concha Domingo, Instituto Valenciano de Investigaciones Agrarias, Spain; Marilyn Rayner, Lund University, Sweden; Jenny Fjällström, Perten Instruments, Sweden; and Kunya Cheaupun, Pathumthani Rice Research Center, Thailand. We would also like to thank the suppliers of the paddy rice.
References References
- AACC International. Method 39-00.01. Near-Infrared Methods—Guidelines for Model Development and Maintenance. Approved Methods of Analysis, 11th ed. Published online at http://methods.aaccnet.org. AACC International, St. Paul, MN.
- AOAC International. Appendix D: Guidelines for collaborative study procedures to validate characteristics of a method of analysis. In: Official Methods of Analysis of AOAC International, 18th ed. The Association, Rockville, MD, 2005.
- Ashida, K., Iida, S., and Yasui, T. Morphological, physical, and chemical properties of grain and flour from chalky rice mutants. Cereal Chem. 86:225, 2009.
- Bedi, J., Fjällström, J., and Purhagen, J. K. Sequential Precision Divider (SPD). Perten Sci. World 14:1, 2017.
- Birla, R., and Chauhan, A. P. S. An efficient method for quality analysis of rice using machine vision system. J. Adv. Inf. Technol. 6:140, 2015.
- Cooper, N. T. W., Siebenmorgen, T. J., and Counce, P. A. Effects of nighttime temperature during kernel development on rice physicochemical properties. Cereal Chem. 83:276, 2008.
- Grain Inspection, Packers and Stockyards Administration, Federal Grain Inspection Service. Official U.S. standards for rice. Available online at www.gipsa.usda.gov/fgis/standards/ricestandards.pdf. U.S. Department of Agriculture, Washington, DC, 2009.
- Horwitz, W. Protocol for the design, conduct and interpretation of method-performance studies. Pure Appl. Chem. 67:331, 1995.
- International Organization for Standardization. ISO 6646:2011: Rice—Determination of the potential milling yield from paddy and from husked rice. ISO, Geneva, Switzerland, 2011.
- McClure, F. D., Lee, J.-K., and Wilson, D. B. Validity of the percent reduction in standard deviation outlier test for screening laboratory means from a collaborative study. J. AOAC Int. 86:1045, 2003.
- Moldenhauer, K. A. K., Gibbons, J. H., and McKenzie, K. S. Rice varieties. Pages 63 and 65 in: Rice: Chemistry and Technology, 3rd ed. E. T. Champagne, ed. AACC International, St. Paul, MN, 2004.
- Purhagen, J., Loosme, R., Wihlborg, N., Fjällström, J., Åberg, P., Andrén, H., Wihlborg, G., Mikaellson, T., Lagerholm, M., and Lindwall, F. PaddyCheck—An instrument for rice quality determination. Instruments 2(3):11, 2018.
- Siebenmorgen, T. J. Laboratory measurement of rice milling yield. Page 173 in: Arkansas Rice Production Handbook—MP192. J. T. Hardke, ed. Available online at www.uaex.edu/publications/pdf/MP192/MP192.pdf. University of Arkansas Division of Agriculture Cooperative Extension Service, Little Rock, AR, 2013.
- State Administration of Industry and Commerce and Standardisation Administration of China. National Standard GB/T 1354-2018, Milled rice. SAIC and SAC, Beijing, China, 2018.
- Zhao, X., and Fitzgerald, M. Climate change: Implications for the yield of edible rice. PloS One. DOI: https://doi.org/10.1371/journal.pone.0066218. 2013.
|