Introduction
Wheat flour solvent retention capacity (SRC) is a well-established method that has been described in many previous papers (1,3). The first approved standardized method recognized in the industry was AACCI Approved Method 56-11.02 (1). Principles, applications, and advantages of the SRC method have been comprehensively described in a review paper by Kweon et al. (4).
SRC is the weight of solvent retained by a wet, swollen flour pellet after centrifugation and is expressed as a percentage of the original flour weight. In this test, three different aqueous solutions, including lactic acid (5% by weight), sodium carbonate (5% by weight), and sucrose (50% by weight), and water alone are used to predict the performance of the principal functional components of a wheat flour system. Generally, lactic acid SRC is associated with glutenin characteristics (an indicator of gluten quality); sodium carbonate SRC is associated with starch damage (and indirectly with flour hardness); and sucrose SRC is associated with pentosan content and gliadin characteristics. Water SRC is associated with all four constituents (4), thus providing an overall picture of SRC in a dough or baked product system.
The gluten performance index (GPI) is calculated by dividing the lactic acid SRC value by the sum of the sucrose SRC and sodium carbonate SRC values. The ratio represents a prediction of the detrimental effects of damaged starch and arabinoxylans on gluten performance (e.g., snack cracker production) (4). The SRC test values serve as indicators of wheat flour chemical composition, rheological properties, and baking quality.
CHOPIN Technologies developed an automated device that follows the main principles of AACCI Method 56-11.02. The aim is not to replace the existing SRC manual method with the new method, but rather to provide an alternative for laboratories searching for a more automated, reproducible, and repeatable solution.
Participating Laboratories
Eleven laboratories that currently use the CHOPIN-SRC instrument and one laboratory that was provided with the instrument solely for the study participated in the collaborative study. The laboratories were chosen to represent a variety of users and included four research institutes, four milling companies, three baking companies, and the instrument developer. Geographical diversity in the study was achieved by the participation of laboratories from the United States, Australia, the United Kingdom, Taiwan, India, Thailand, and Chile.
The study was conducted in two parts. In the first part, nine laboratories were asked to test two flour samples (samples 11 and 12) to ensure that the study setup and testing method instructions were clear and efficient. Three laboratories that did not participate in testing samples 11 and 12 subsequently joined the study for the second part. After the setup was validated, in the second part of the study a total of 12 laboratories performed the tests on the remaining 10 flour samples under setup and testing conditions that were identical to those used in the first part of the study. Of the 12 flour samples used in the collaborative study, 2 were blind duplicates, so that the collaborators could test duplicate samples twice without knowing it.
 Flour Samples and Sample Preparation
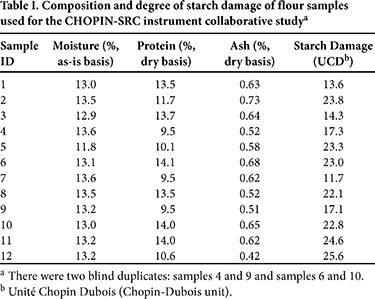
The samples were selected by CHOPIN Technologies’ application laboratory to represent different industrial flour samples and to obtain a wide variation in SRC values. The chemical composition of the selected samples determined by Groupe Qualtech is shown in Table I. The two blind duplicates were samples 4 and 9 and samples 6 and 10. The moisture content of the 12 flour samples ranged from 11.8 to 13.6%, protein content ranged from 9.5 to 14.1% (dry basis), ash content ranged from 0.42 to 0.73% (dry basis), and starch damage ranged from 11.7 to 25.6 UCD (Chopin-Dubois unit). Wheat flour samples encompassing a wide range of compositions and characteristics were selected to examine the application of the method for both soft wheat flours and hard wheat flours. The 12 selected flour samples were sent to the Bureau Interprofessionnel des Etudes Analytiques (International Bureau for Analytical Studies) in Paris, France, for preparation of the subsamples and shipping to the participating laboratories.
Method and Qualitative Evaluation
The collaborators were provided with a method draft written in the AACCI Approved Method format, a video illustrating the key points of the procedure to improve their understanding of the method, and a result-reporting sheet. All laboratories tested each sample in duplicate and reported results for both replications. The reported data included flour moisture content (as measured by each collaborator’s own method), water SRC (WA-SRC), sodium carbonate SRC (CAR-SRC), sucrose SRC (SUC-SRC), and lactic acid SRC (LAC-SRC). To avoid any confusion that might result from an error in transcription of the results, participants were also asked to send the electronic files of the results extracted from the CHOPIN-SRC instrument’s software.
Because its use is becoming increasingly popular, GPI was included as the test parameter and calculated using the formula (GPI = [LAC-SRC × 100]/[CAR-SRC + SUC-SRC]) (4). The calculation of GPI was performed by the CHOPIN laboratory.
Results and Statistical Analyses
Collaborative study results were analyzed following the AACCI statistical analysis requirements. Outliers were removed using Grubbs and Cochran tests. Blind duplicates were analyzed according to the AOAC statistical guidelines (2). Complete data sets and sets without outliers were sent to an AACCI statistician, who reviewed and reported them as meeting the organization’s standards.
The flour samples selected for the collaborative study exhibited wide differences in protein and ash contents and degree of starch damage (Table I), ranging from 9.5 to 14.1%, 0.42 to 0.73%, and 11.7 to 25.6 UCD, respectively.
Repeatability and reproducibility estimates for the blind duplicate samples for all four SRC tests and GPI are summarized in Table II.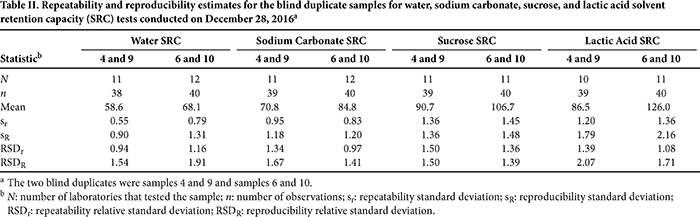
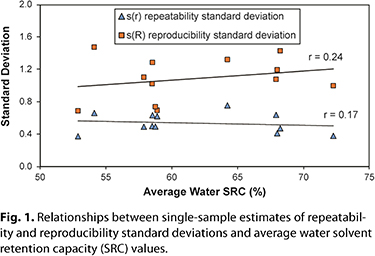 Water SRC. The average water SRC values for the 12 flour samples ranged from 52.9 to 72.3%, with a mean value of 61.7% (Table III). The repeatability standard deviation (SD) and reproducibility SD for the water SRC test based on the blind duplicate samples ranged from 0.55 to 0.79 and 0.90 to 1.31, respectively. Repeatability relative standard deviation (RSDr) ranged from 0.94 to 1.16% and reproducibility relative standard deviation (RSDR) ranged from 1.54 to 1.91% (Table II), indicating that replication standard errors within a laboratory and between laboratories were acceptably low. The RSDr and RSDR for the water SRC test (AACCI Method 56-11.02) reported from the collaborative study ranged from 0.86 to 1.09 and 2.34 to 2.55, respectively (3); therefore, the CHOPIN-water SRC test had similar repeatability to and better reproducibility than AACCI Method 56-11.02. The high repeatability and reproducibility for the water SRC test was further substantiated by the small within-lab and between-lab SDs determined by the duplicate runs for each flour sample by each collaborator (Table III). The within-lab and between-lab SDs ranged from 0.37 to 0.75 and 0.69 to 1.47, respectively. Much higher reproducibility SD and RSDR than repeatability SD and RSDr, respectively (Tables II and III; Fig. 1), were likely due to the differences in instrument, performer, and laboratory environmental conditions between participating laboratories. Both within-lab and between-lab SDs showed no relationship with the average water SRC values (Fig. 1), indicating that repeatability and reproducibility were stable in the range of water SRC values for the tested samples.
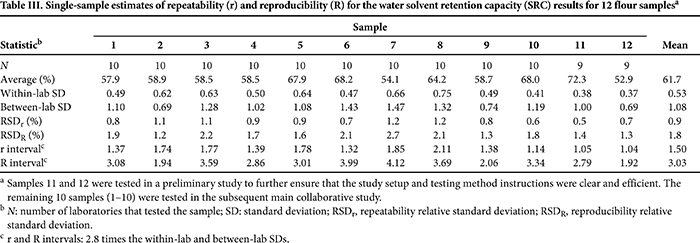
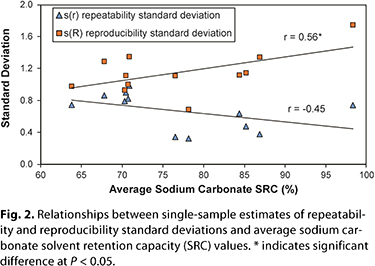 Sodium Carbonate SRC. Repeatability and reproducibility statistics for the sodium carbonate SRC test based on blind duplicate estimates are presented in Table II, and those based on single-sample estimates are presented in Table IV. The average sodium carbonate SRC values for the 12 samples ranged from 63.8 to 98.3%, with a mean of 76.9%. Similar to the water SRC test, the repeatability and reproducibility SDs for the sodium carbonate SRC test were relatively low and ranged from 0.83 to 1.20. RSDr and RSDR ranged from 0.97 to 1.34% and 1.41 to 1.67%, respectively (Table II), indicating that the sodium carbonate SRC test was highly repeatable and reproducible. The within-lab and between-lab SDs for the 12 samples were also low, with means of 0.67 and 1.75, respectively (Table IV), again supporting the high repeatability and reproducibility of the sodium carbonate SRC test. The mean RSDr and RSDR for the 12 samples were 0.9 and 1.5%, respectively, and were much lower than those reported in the collaborative study for AACCI Method 56-11.02 (3). The much higher reproducibility SD than repeatability SD for the blind duplicate samples (Table II) and the higher between-lab SD than within-lab SD (Table IV) were probably due to the differences in instrument, performer, and laboratory environmental conditions between participating laboratories. No relationship was observed between the within-lab SD and the average sodium carbonate SRC values, indicating that the repeatability SD was not greatly affected by the magnitude of the sodium carbonate SRC value. The between-lab SD showed a significant relationship with the average sodium carbonate SRC values (Fig. 2), increasing as the measured sodium carbonate SRC values increased.
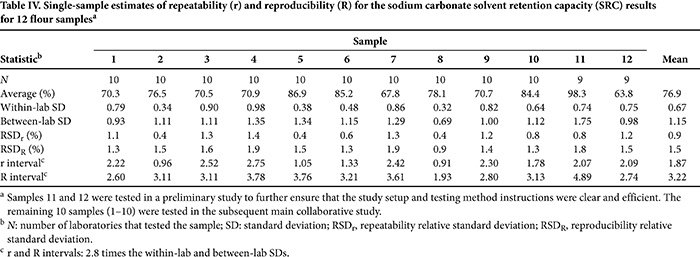
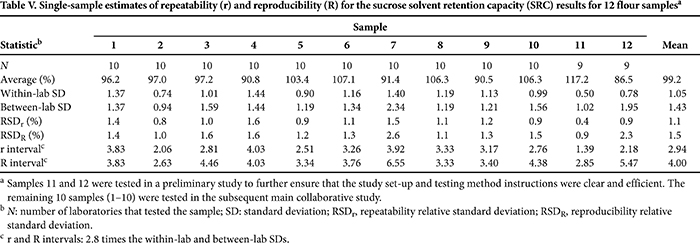
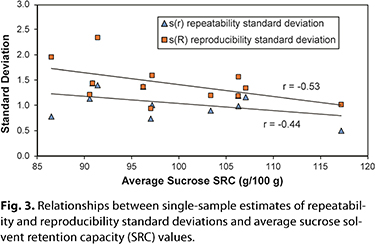 Sucrose SRC. The average sucrose SRC values for the 12 samples ranged from 86.5 to 117.2%, with a mean of 99.2% (Table V). The sucrose SRC test repeatability SD ranged from 1.36 to 1.45, and the reproducibility SD ranged from 1.35 to 1.48, with relative SD for the blind duplicate estimates ranging from 1.36 to 1.50% (Table II). The means of the within-lab and between-lab SDs for the 12 samples were 1.05 and 1.43, respectively, which resulted in an RSDr mean of 1.1% and an RSDR mean of 1.5% (Table V). The reported RSDr and RSDR values from the collaborative study of AACCI Method 56-11.02 were 1.61 and 3.50, respectively (3). Relatively small differences in the repeatability and reproducibility statistics for both the blind duplicate and single-sample estimates suggest that the CHOPIN sucrose SRC test yielded highly consistent results across collaborators. Both within-lab and between-lab SDs showed no relationship with the average sucrose SRC values (Fig. 3), indicating that neither the repeatability nor the reproducibility of the test was greatly affected by the magnitude of the determined sucrose SRC value.
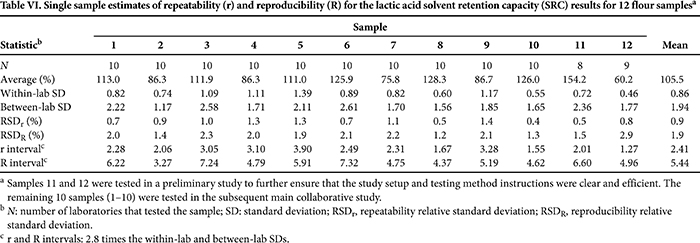
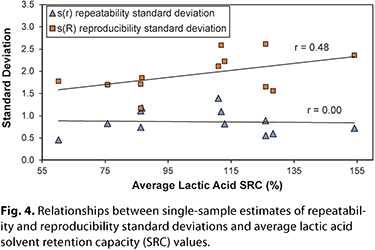 Lactic Acid SRC. The average lactic acid SRC values for the 12 samples ranged from 60.2 to 154.2% (Table VI), showing a wide variation in protein strength among the selected samples. The sucrose SRC test exhibited RSDr ranging from 1.08 to 1.39% and RSDR ranging from 1.71 to 2.07% for the blind duplicate estimates (Table II), which was comparable to RSDr and RSDR for the water SRC and sodium carbonate SRC tests. The means of the within-lab and between-lab SDs for the 12 samples were 0.86 and 1.94, respectively, which resulted in an RSDr mean of 0.9% and an RSDR mean of 1.9% (Table VI), which were all lower than the respective reported values from the collaborative study of AACCI Method 56-11.02 (3). Similar to the water SRC and sodium carbonate SRC tests, all of the repeatability statistics were smaller than the reproducibility statistics. The absence of a relationship between the average lactic acid SRC values and both the within-lab and between-lab SDs (Fig. 4) indicates that neither repeatability nor reproducibility for the test was greatly affected by the magnitude of the determined sucrose SRC value.
 Conclusions
A collaborative study was conducted to evaluate the performance of an automated measurement of flour SRC using the CHOPIN-SRC instrument. The results of the collaborative study indicate that the relative SDs (measures of coefficients of variation) within a laboratory and between laboratories for all four automated SRC tests are comparable to or even lower than those reported in the collaborative study of AACCI Method 56-11.02. The automated SRC tests appear to be highly repeatable and reproducible. Differences in the measured SRC values between laboratories are expected to be lower with the use of the automated CHOPIN-SRC tests because of the much lower relative SDs between laboratories compared with AACCI Method 56-11.02. The study also demonstrated that the tests are applicable to wheat flours with much wider ranges of SRC values than those previously believed to be acceptable, thus they can be used for the evaluation of not only wheat with a soft kernel texture and low protein content, but also for wheat with a hard kernel texture and high protein content. This method has been approved by the AACCI Soft Wheat and Flour Products Committee and also by the AACCI Approved Method Technical Committee as AACCI Approved Method 56-15.01 on the condition of revision.
Acknowledgments
We thank all of the collaborators: Vijay Anand (Naga Flour Mills, India), Clothilde Baker (Campden BRI, U.K.), Larisa Cato (Australian Export Grains Innovation Centre, Australia), June Davis (Bay State Milling, U.S.A.), Janette Gelroth (American Institute of Baking, U.S.A.), Gary Hou (Wheat Marketing Center, U.S.A.), Mikael Hung (Chia Fa Flour Mills, China), Yulai Jin (Kellogg’s, U.S.A.), Bon Lee (Wheat Marketing Center, U.S.A.), Caryn Ong (Wheat Marketing Center, U.S.A.), Carmen Porland (Bay State Milling, U.S.A.), Debi Rogers (American Institute of Baking, U.S.A.), Sunee (Thaï Flour Mills, Thaïland), Sandra Vaz (Nestlé, Chile), Zhanfeng Xu (PepsiCo, U.S.A.), and John Yen (PepsiCo, U.S.A.).
A big thank you goes to the AACCI Soft Wheat Methods Committee and particularly Diane Gannon and Terry Nelsen for their support in setting up the collaborative study and the statistical analysis. We also thank Meera Kweon, Louise Slade, and Harry Levine for their outstanding help in reviewing and editing this document.