|
|
02 Features
Print To PDF
DisplayTitle Historical and Global Perspectives on Grains and Whole Grains within Dietary Guidelines
Authors Felicity Curtain1 and Sara Grafenauer1,2,3
Affiliations
© 2020 Cereals & Grains Association
Abstract
CFWAbstract Food-based dietary guidelines provide advice on healthy eating for populations and help guide health and nutrition policies. Grains, particularly whole grains, have long played a key role in the human diet, and their role in nutrition and chronic disease prevention is well established. Despite this, whole grain consumption is low globally. The aim of this study is to summarize and explore Australian dietary recommendations on grains and whole grains over time and to offer a global perspective on how these recommendations compare with other dietary guidelines around the world. In Australia, grains have remained a constant in food group guides since 1955, with a focus on whole grains beginning in the 1979 dietary guidelines. Globally, all 90 countries with identified food guides promote grains, and 44% specifically encourage consumption of whole grains. Guidelines generally emphasize whole grains within a grain food statement, using “mostly” and “preferably” as an additional requirement. Many public health initiatives, such as the Australian front-of-pack labeling system (the Health Star Rating), do not include whole grain as part of the algorithm, highlighting a disconnect between dietary guidance and policy. To shift consumption patterns, a multi-stakeholder approach is required, including government, research organizations, the food industry, public health groups, and consumers. More specific wording and direct guidelines may also be needed to achieve the required outcomes of swapping whole grains for refined grains.
Trying to reach content?
View Full Article
if you don't have access, become a member
Page Content Dietary recommendations in the form of food selection guides, or dietary guidelines, support food choices for a healthy population and form the basis of public health policies (1). Recommendations are based on existing knowledge and links between nutrition and the health of the general population and aim to support nutrition education initiatives and consider social and economic issues. Grains and grain-based foods are common dietary staples, with rice, maize, and wheat estimated to provide 60% of global energy intake (2), and they have formed a key component of dietary recommendations for many years. In Australia, National Nutrition Survey data (2011–2012) indicate that grain-based foods such as breads, cereals, pasta, rice, and noodles are the leading contributors of seven key nutrients in the diet, including carbohydrates, dietary fiber, folate, thiamine, iron, magnesium, and iodine (3). However, even though most Australians consume grain foods, few meet recommendations for whole grain foods, which are described by Food Standards Australia New Zealand (FSANZ) (4) as
|
The intact grain or the dehulled, ground, milled, cracked or flaked grain where the constituents—endosperm, germ and bran—are present in such proportions that represent the typical ratio of those fractions occurring in the whole cereal, and includes wholemeal. |
The aim of this study is to outline historical and global perspectives on grain and whole grain food recommendations and to provide guidance for future whole grain promotion.
Grain Food Promotion Using the Five Food Groups and Australian Dietary Guidelines
The first food guide was published in Australia by the Commonwealth Department of Health in 1955 and included five food groups, listed in priority order, as the basis of the recommendations (5). At that time, bread and cereals (3–4 servings) were listed fourth in the priority order after milk; meat, poultry, fish, eggs, and cheese; and fruit and vegetable groups. As a necessity, protein foods were a priority with the focus on preventing nutrient deficiencies (e.g., vitamin A and iron) rather than on excess energy and related chronic diseases such as diabetes mellitus, heart disease, colon cancer, and obesity (6). Bread and cereals were listed ahead of butter and table margarine (Table I).
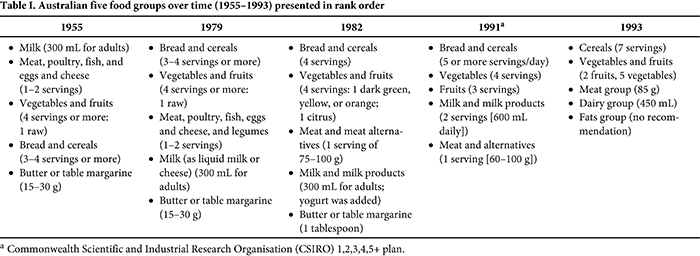
In 1979, 24 years later, the dietary goals for Australians were documented by the Commonwealth Department of Health (5). These included a statement, “Eat more breads and cereals (preferably whole grain) and vegetables and fruits,” which were listed as the sixth of eight guidelines (Table II). This was the first mention of whole grains in government guidelines. Whole grains have consistently been recommended since that time (7) based on their dietary fiber, protein, B group vitamins, minerals, and antioxidant contents compared with refined grain foods, the nutrients of which are altered through processing (8).
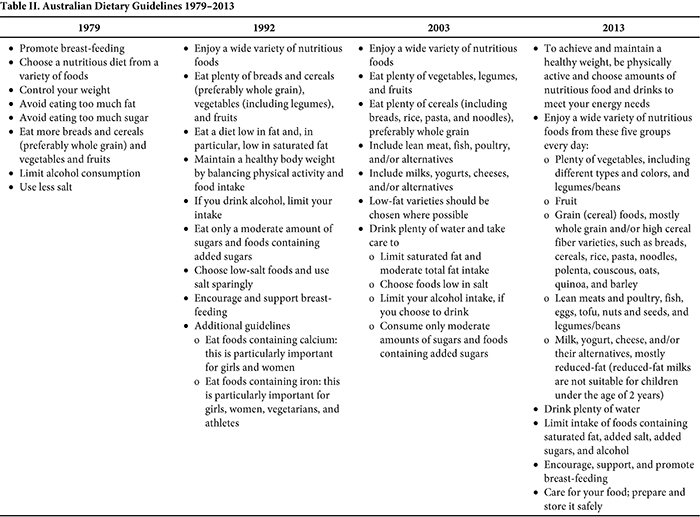
In 1982 the five food groups were revised, with 4 or more servings of bread and cereals listed ahead of all other groups, signaling a further change in emphasis. At the same time, meat was reduced, and yogurt was added to the milk and milk products group. Just short of 10 years later, in 1991, the Commonwealth Scientific and Industrial Research Organisation (CSIRO), with the guidance of a team headed by Katrine Baghurst, launched a 1,2,3,4,5+ plan (5). Bread and cereal foods were increased to 5 or more servings/day; meat was reduced; fruits, vegetables, and dairy were increased; and use of fats was assumed via an allowance on bread (6). This was a quantified system aimed at helping consumers achieve the Recommended Dietary Intakes and, therefore, addressed the total diet. A year later, the revised Australian Dietary Guidelines recommended eating “plenty of breads and cereals (preferably whole grain), vegetables (including legumes) and fruits,” following the general statement, “Enjoy a wide variety of nutritious foods.” These guidelines were listed in priority order, and there was a distinct change in the language used. Earlier guidelines emphasized avoiding particular nutrients and were more permissive, with the aim of guiding better food choices. In 1994, the first National Food & Nutrition Policy was released with the aim of improving health and reducing preventable diet-related diseases and early death and disability among Australians (9). The strategies in this document supported the Australian Dietary Guidelines (10,11). In 1993 the Food and Health standing committee of the National Health and Medical Research Council updated the Core Food Groups model (replacing the five food groups), further increasing the cereal food group recommendations to 7 servings (Table I). However, these recommendations were designed not as an education tool per se, but as the basis for the development of nutrition education tools and resources and were based on minimum amounts of food (6).
In 1998 the Australian Guide to Healthy Eating (AGHE), based on the Core Food Groups, was launched and included “indulgence” foods (6). At the time, research was emerging suggesting the benefits of whole grain over refined grain foods with a high glycemic index. This guide featured a very large grain foods section, followed by fruits and vegetables, and although there was an emphasis on whole grains, with illustrations of brown rice and wholemeal bread, it is unclear whether these were sufficient to guide food choices toward whole grains.
A decade after the last iteration, new dietary guidelines were published in 2003 as a set to be considered as a whole rather than as individual guidelines. A move away from the prioritized order of previous editions was highlighted with a broad heading, “Enjoy a wide variety of nutritious foods,” followed by more specific suggestions for each food group. Following the statement, “Eat plenty of vegetables, legumes and fruits,” was a statement supporting grain foods: “Eat plenty of cereals (including breads, rice, pasta and noodles), preferably wholegrain.” The 2013 guidelines followed with a similar emphasis but a broadening of the list of suggested grain foods: “mostly wholegrain and/or high cereal fiber varieties, such as breads, cereals, rice, pasta, noodles, polenta, couscous, oats, quinoa and barley” (Table II). The AGHE was updated in 2010 and 2013 to support the Australian Dietary Guidelines and are an extension of the five food groups, which are no longer in favor because they do not address issues of macronutrient excess or inadequacies (12) or country-specific issues with diet quality.
Comparison of Grain and Whole Grain Recommendations in Dietary Guidelines
A comparison of 90 food guides from around the world found many similarities between groups—most recommend a variety of foods, particularly fruits and vegetables, legumes, and some animal-based foods and recommend limiting sugar, fat, and salt. However, messages regarding whole grains are inconsistent, despite global guidance from the World Health Organization (WHO) highlighting their importance (13,14). All countries include “starchy staples” in their guidelines, and 14% provide quantitative recommendations detailing the number of servings or times per day foods should be consumed. Nearly half (44%) of all countries specifically mention whole grains, with visual representations included in around half of all guidelines, while only 10% mention fiber in relation to whole grain foods (14).
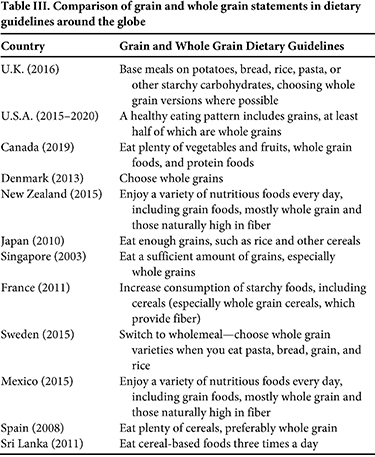
A comparison of global grain and whole grain recommendations from a variety of dietary guidelines is provided in Table III. Like Australia, many countries, including the United Kingdom, the United States, Canada, Denmark, New Zealand, Singapore, France, Sweden, Germany, Mexico, and Spain promote whole grain consumption (15–25). Conversely, countries such as Japan and Sri Lanka encourage consumption of grains or cereal foods, but do not emphasize whole grain options (26,27). The U.S. guidelines provide the most specific guidance, with “at least half” of all grains recommended as whole grains; however, these guidelines are currently under review.
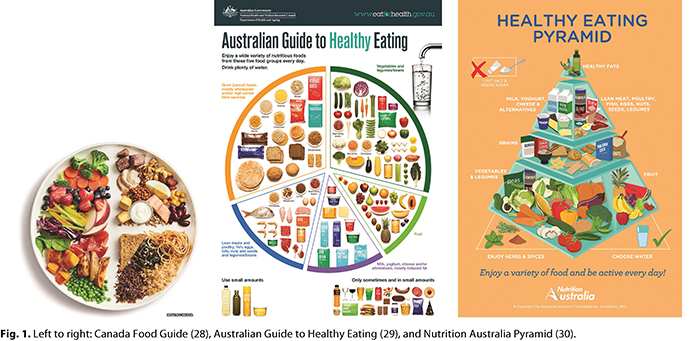
In Canada, new dietary guidelines and evidence documents are being developed. It is notable that the visual tool for guidance has been released and that grain foods are depicted only as whole grain foods (28) (Fig. 1). This is in contrast to the current Australian visual guide and that from Nutrition Australia, in which a range of grain foods, refined and whole grains are depicted (29,30) (Fig. 1).
Beyond dietary guidelines, the emphasis on whole grain food choices has been echoed globally. Seal et al. (31) found that of 127 organizations (including governments, non-governmental organizations [NGOs], charities and professional bodies, the WHO, and the European Food Safety Authority) 49 provided a whole grain intake recommendation. These ranged from “specific” target amounts (e.g., x grams of whole grain/day) to “semi-quantitative,” in which whole grain intake was linked with cereal grain foods (e.g., x servings of cereals, of which y servings should be whole grain), to “non-specific” suggestions based on “eating more” whole grain or “choosing whole grain where possible.” Specific (numerical) recommendations have only been adopted by two countries (the United States and Denmark). In Australia, the Grains & Legumes Nutrition Council (GLNC) suggests a whole grain daily target intake (DTI) of 48 g of whole grain per day for adults and 32 g for children 9 years of age and older (32,33), but the Australian Dietary Guidelines contains only a generic recommendation to “Eat plenty of cereals (including breads, rice, pasta and noodles), preferably whole grain.” Seal et al. (31) considered the reasons for these inconsistencies and stated that they may have arisen because nutrition targets are set for dietary fiber, which is considered a nutrient in food standards, and rather than acknowledging the health benefits of consuming whole grains separately, they are promoted as a source of dietary fiber.
Despite the support for whole grains in dietary guidance, global consumption remains low. The Global Burden of Disease Study found all 195 included countries fell severely short of optimal whole grain consumption levels (34). In Australia, whole grain consumption is estimated at 21 g/day for adults, less than half of the 48 g DTI, and 30% consider themselves as “non-consumers” of whole grains (35), with negative sensory perception, lack of knowledge on how to find them, and lack of awareness of their health benefits being the main barriers (36,37). This is concerning, as among dietary risk factors globally, diets low in whole grains have been deemed the second leading risk factor for mortality (behind diets high in sodium) and the greatest risk factor for disability adjusted life years (DALYs), accounting for 82.5 million DALYs (34). Extensive observational evidence supports the role of whole grains in promoting health. A dose response has been established for whole grains and chronic disease, with consumption of up to 3 servings/day associated with reduced risk of cardiovascular disease, type 2 diabetes, and overweight and obesity (38). Strong evidence also supports whole grains as a protective factor against all-cause mortality (39) and colorectal cancer (40), although results are less consistent in randomized controlled trials.
A disconnect between whole grain promotion through dietary guidelines and actual consumption levels highlights the need to promote and educate consumers about their health benefits at multiple levels, perhaps within a socio-ecological model that could drive promotion. The model considers the influence of intrapersonal, interpersonal, environmental, and organizational or policy factors on individual and population-level behavior changes. Although this model is rarely used in practice, the objective is to create changes on various levels (41). This is emphasized by Suthers et al. (42) who presented a systematic review of whole grain health promotion efforts globally. They suggest that the key to success is to target multiple stakeholders in the food supply chain (including regulatory authorities and industry), academia, government, advocacy groups, product developers, the surrounding environment, and consumers. This includes outlining target intakes in dietary guidelines and food-labeling initiatives (42).
Denmark is one of the few nations to have substantially increased whole grain consumption in recent years through their successful Danish Wholegrain Public Private Partnership (PPP) (43). Established in 2008, the PPP engages 31 partners across areas such as food regulation, NGOs, and the food industry. Over a decade, the PPP saw national whole grain consumption increase by 75% from 36 g/day/10 MJ to 63 g/day/10 MJ. Those meeting the recommended intake of 75 g of whole grain/day also rose from 6 to 30% (43). To achieve increases in whole grain consumption in Australia, a similar collaborative approach should be taken. Further, partnerships should include public and private entities, forming the basis for the collaboration, and target multiple points in the socio-ecological food provision system. GLNC, as a health promotion charity, is well placed to influence a broad range of stakeholders and has taken a leadership position in guiding the industry with a framework for food labeling, working with regulatory bodies such as FSANZ and promoting whole grains through both advocacy and consumer promotions (44,45).
Food Labeling—A Way to Encourage Consumption of Whole Grains?
Food labeling is an important policy tool in promoting healthier food choices, including nutrition content and health claims that draw attention to certain health benefits or nutritional characteristics of a product (46). In Australia, such voluntary claims are regulated by FSANZ, which outlines conditions that must be met in order to make claims (47). However, it does not regulate the use of on-pack whole grain claims, as with nutrients such as dietary fiber, energy, vitamins, minerals, protein, carbohydrate, and fat (47).
To fill this gap, and point consumers toward whole grain food products, GLNC led the development of the Code of Practice for Whole Grain Ingredient Content Claims in Australia and New Zealand in 2013. This code of practice is aimed at inspiring innovation within the food industry while providing the necessary framework to protect consumers and allow much needed promotion. GLNC measures compliance with the code through rolling category audits of grain foods. The code provides guidance on the use of whole grain claims with cut-off values of at least 8 g/manufacturer serving (contains whole grain), at least 16 g/serving (high in whole grain), and at least 24 g/serving (very high in whole grain) (48). As of June 2019, 65% of eligible whole grain products were registered with the code, and whole grain claims were being made on their food packaging (GLNC, unpublished data).
The code has similarities to the Whole Grain Stamp—an on-pack logo developed in the United States by the nonprofit Whole Grains Council in 2005. The system identifies products made with 100% or 50% whole grains, with minimum levels of 16 and 8 g established for each. The stamp is featured on more than 13,000 products in 61 countries, including the United States, Canada, China, Denmark, Saudi Arabia, South Africa, Italy, and many others (49). Consumer perception of the Whole Grain Stamp is strong: 80% of those surveyed trusted the stamp, and 79% stated they would use the stamp as part of their decision-making process (50). Additionally, around half (45%) of 139 dietitians surveyed were familiar with the system and likely to promote it (51). More broadly, consumer perception of currently regulated nutrition claims (such as those indicating protein, sugar, fat, and dietary fiber content) is mixed, with some research supporting their role in promoting healthier food purchases, and others indicating the opposite based on lowered taste expectations (52–54). When viewed in isolation, there is criticism that health and nutrition content claims can lead to cognitive bias or viewing a food as healthier based on a single nutritional aspect. Front-of-pack labeling systems that summarize the nutrition information for a product in an easily interpreted symbol, wording, or figure are thought to overcome the risk of cognitive bias, although few systems globally consider whole grain content in their criteria (55).
In Australia, the Health Star Rating (HSR) system aims to guide healthier choices within food categories (56) by ranking foods on a scale between 0.5 (1/2) and 5 stars, based on the premise that more stars equates to a healthier product (56). The HSR system was designed to reflect the Australian Dietary Guidelines (57) and uses an algorithm to rate foods on a per 100 g basis, considering both “negative” contents (e.g., energy, sodium, saturated fat, and total sugars), and “positive” contents (fruits, vegetables, nuts, or legumes), as well as dietary fiber and protein contents, which is then converted to a star rating. Currently, the HSR does not directly reward grain foods for containing whole grain through the algorithm, and research has shown this translates to only minor score differences between refined and whole grain foods, such as white and brown rice or pasta (58) and snacks such as muesli bars (45), failing to accurately communicate the health benefits of whole grains. This omission has been justified by the fact that some whole grain foods may achieve a higher score based on their dietary fiber content, which is regarded as a poor indicator of whole grain content. In fact, the nutrition profiles of different whole grains vary significantly: the dietary fiber contents of bulgur and barley are five times higher than that of brown rice, and other nutrients such as vitamin A and beta-carotene are found in corn but not in brown rice, oats, and sorghum (59).
The Australian HSR is not unique in overlooking whole grain in its front-of-pack labeling system. “Warning labels” used in Finland, Thailand, Chile, Israel, and Canada merely offer cautionary statements on foods with excessive energy, saturated fat, total sugars, and sodium and do not take into account “positive” contents or ingredients (60). The U.K. Multiple Traffic Lights label displays amounts of energy, total and saturated fats, total sugars, and salt, assigning a color code to the four nutrients—red (high), amber (medium), or green (low), but does not account for “positive” contents or ingredients (61). The Nutri-Score system implemented in France in 2017 and now being rolled out in other European countries has similarities to the HSR, as it relies on a quantitative algorithm to rank products on a qualitative scale from A to E (healthiest to unhealthiest). Like the HSR, the Nutri-Score considers “unfavorable” contents (energy, total sugars, saturated fats, and sodium) and subtracts these from “favorable” contents (fruits, vegetables, nuts, dietary fiber, and protein), but also excludes whole grain (62). In contrast, the Key Hole label, the longest-standing front-of-pack labeling system, developed in 1989 in Sweden and now used widely among Nordic countries, does recognize whole grain in its system. The Key Hole aims to promote healthier choices within categories based on requirements such as less and healthier fats, less sugars, less salt, and more dietary fiber and whole grains (63). Similarly, the Singapore Healthier Choices logo uses nutrient criteria for more than 60 food subcategories based on both “negative” additions (total and saturated fats, trans fats, sodium, and total sugar), as well as “positive” contents (calcium, dietary fiber, and whole grains) (64). These two systems appear to be unique in considering both dietary fiber and whole grains compared with other front-of-pack systems discussed, including the HSR, which only accounts for dietary fiber. A variety of front-of-pack initiatives, including the HSR, Whole Grain Stamp, Key Hole label, and the Singapore Healthier Choices logo, are shown in Figure 2. Globally, there is movement toward common guidance focused on whole grains in foods, and once this is achieved, consumer research as to the most effective front-of-pack whole grain labeling system will be important.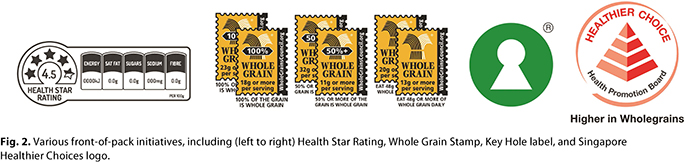
The Future
Grain foods are universally promoted worldwide, and based on their clear health benefits, whole grains are specifically recommended by almost half of countries with food guides. Despite this, consumption globally remains low. To encourage greater whole grain intake, a collaborative approach is recommended, and clear opportunities exist to engage with stakeholders across the food supply, including government, research organizations, food industry, public health groups, and consumers. Basing future efforts on successful campaigns, such as the Danish PPP, and focusing on other government supported initiatives, such as the HSR used in Australia, may assist in strengthening the message and lead to meaningful changes with measurable health benefits. Whereas the current Australian Dietary Guidelines support “grain (cereal) foods, mostly whole grain and/or high cereal fiber varieties, such as breads, cereals, rice, pasta, noodles, polenta, couscous, oats, quinoa and barley,” it may be useful to further strengthen the whole grain message, particularly in light of the new Canadian guidelines. GLNC would support a change in the wording of future guidelines to focus consumer attention more on “choosing whole grain and high fiber cereal foods, selecting from a wide range and types of grains.”
Acknowledgments
In writing this, the Grains & Legumes Nutrition Council would like to acknowledge the many dietitians who have contributed to the evidence base and writing of dietary guidelines in Australia.
 Felicity Curtain is an Accredited Practising Dietitian based in Sydney, Australia, with diverse experience across nutrition communication, food regulation and policy, and FMCG (fast-moving consumer goods). Felicity is passionate about influencing the food supply and empowering consumers to make healthier food choices. Connect with Felicity through LinkedIn or Twitter. Felicity Curtain is an Accredited Practising Dietitian based in Sydney, Australia, with diverse experience across nutrition communication, food regulation and policy, and FMCG (fast-moving consumer goods). Felicity is passionate about influencing the food supply and empowering consumers to make healthier food choices. Connect with Felicity through LinkedIn or Twitter.
 Sara Grafenauer is an Advanced Accredited Practising Dietitian and the general manager of the Grains & Legumes Nutrition Council. She is a nutrition marketing specialist with commercial experience and a clinically focused Ph.D. degree, examining dietary patterns and dietary change in weight loss. She is an Honorary Fellow at the University of Wollongong, providing lectures and research supervision. Sara is the board director for Nutrition Australia and the global Whole Grain Initiative. Connect with Sara through LinkedIn and Twitter. Sara Grafenauer is an Advanced Accredited Practising Dietitian and the general manager of the Grains & Legumes Nutrition Council. She is a nutrition marketing specialist with commercial experience and a clinically focused Ph.D. degree, examining dietary patterns and dietary change in weight loss. She is an Honorary Fellow at the University of Wollongong, providing lectures and research supervision. Sara is the board director for Nutrition Australia and the global Whole Grain Initiative. Connect with Sara through LinkedIn and Twitter.
References References
- Food and Agriculture Organization of the United Nations. Food-based dietary guidelines. Published online at www.fao.org/nutrition/education/food-dietary-guidelines/en. FAO, Rome, Italy, 2019.
- Food and Agriculture Organisation of the United Nations. Staple foods: What do people eat? Published online at www.fao.org/3/u8480e/U8480E07.htm. FAO, Rome, Italy, 2019.
- Australian Bureau of Statistics. 4364.0.55.007—Australian Health Survey: Nutrition and nutrients, 2011–12. Cereals and cereal products. Published online at www.abs.gov.au/ausstats/abs@.nsf/Lookup/by%20Subject/4364.0.55.007~2011-12~Main%20Features~Cereals%20and%20cereal%20products~720. ABS, Belconnen, Australia, 2015.
- Food Standards Australia New Zealand. Wholegrain food. Published online at www.foodstandards.gov.au/consumer/nutrition/wholegrain/Pages/default.aspx. FSANZ, Kingston, Australia, and Wellington, New Zealand, 2016.
- Santich, B. What the Doctor Ordered—150 Years of Dietary Advice in Australia. Hyland House Publishing, Victoria, Australia, 1995.
- Wahlqvist, M. L. Food & Nutrition Australia New Zealand, 2nd ed. Allen & Unwin PTY LTD, Melbourne, Australia, 2002.
- Department of Community Services and Health. Towards better nutrition for Australians. Report of the Nutrition Taskforce of the Better Health Commission. Australian Government Publishing Service, Canberra, Australia, 1987.
- National Health and Medical Research Council. Grain (cereal) foods, mostly wholegrain and/or high cereal fibre varieties. Published online at www.eatforhealth.gov.au/food-essentials/five-food-groups/grain-cereal-foods-mostly-wholegrain-and-or-high-cereal-fibre. NHMRC, Canberra, Australia, 2015.
- Commonwealth Department of Health and Family Services. Australian Food & Nutrition Policy. Australian Government Publishing Service, Canberra, Australia, 1994.
- Santich, B. Paradigm shift in the history of dietary advice in Australia. Nutr. Diet. 62:4, 2005.
- Commonwealth Department of Health. Towards Better Nutrition for Australians. Australian Government Publishing Service, Canberra, Australia, 1987.
- Wahlqvist, M. L., and Gallegos, D. Food and Nutrition: Sustainable Food and Health Systems. Allen & Unwin PTY LTD, Crows Nest, Australia, 2020.
- Painter, J. Comparison of international food guide pictorial representations. J. Am. Diet. Assoc. 102:483, 2002.
- Herforth, A., Arimond, M., Álvarez-Sánchez, C., Coates, J., Christianson, K., and Muehlhoff, E. A global review of food-based dietary guidelines. Adv. Nutr. 10:590, 2019.
- U.S. Department of Health and Human Services and U.S. Department of Agriculture. Key elements of healthy eating patterns. In: 2015-2020 Dietary Guidelines for Americans, 8th ed. Published online at https://health.gov/dietaryguidelines/2015/guidelines/chapter-1/a-closer-look-inside-healthy-eating-patterns/#callout-wholegrains. HHS, Washington, DC, 2015.
- Government of Canada. Canada’s Food Guide. Published online at https://food-guide.canada.ca/en. Government of Canada, Ottawa, ON, Canada, 2020.
- The Danish Veterinary and Food Administration. Choose whole grains. Published online at https://altomkost.dk/raad-og-anbefalinger/de-officielle-kostraad/vaelg-fuldkorn. Danish Veterinary and Food Administration, Glostrup, Denmark, 2019.
- Mangerbouge Programme National Nutrition Sante. Starchy foods. Published online at www.mangerbouger.fr/Les-9-reperes/Les-9-reperes-a-la-loupe/Les-feculents. Public Health France, Saint-Maurice, France, 2018.
- German Nutrition Society. Eat and drink fully according to the 10 rules of the DGE: Whole grain. Published online at www.dge.de/ernaehrungspraxis/vollwertige-ernaehrung/10-regeln-der-dge. German Nutrition Society, Bonn, Germany, 2019.
- Ministry of Health Singapore. How to eat right to feel right. Published online at www.healthhub.sg/live-healthy/15/dietary_guidelines_adults. MOH, Singapore, 2019.
- National Health Service. Starchy foods and carbohydrates. Published online at www.nhs.uk/live-well/eat-well/starchy-foods-and-carbohydrates. NHS, London, U.K., 2017.
- Ministry of Health. Eating and Activity Guidelines for New Zealand Adults. Published online at www.health.govt.nz/publication/eating-and-activity-guidelines-new-zealand-adults. Ministry of Health, Wellington, New Zealand, 2015.
- Brugård Konde, A., Njerselius, R., Haglund, L., Jansson, A., Pearson, M., Färnstrand, J. S., and Johansson, A.-K. Swedish dietary guidelines—Risk and benefit management report. Published online at www.livsmedelsverket.se/globalassets/rapporter/2015/rapp-hanteringsrapport-engelska-omslag--inlaga--bilagor-eng-version.pdf. Swedish National Food Agency, Uppsala, Sweden, 2015.
- Spanish Ministry of Health, Social Services and Equality. Eat healthy and move: 12 healthy decisions. Spanish Agency for Consumer Affairs, Food Safety and Nutrition, Madrid, Spain, 2008.
- National Institute of Public Health. Dietary and physical activity guidelines in the context of overweight and obesity in the Mexican population. Published online at www.anmm.org.mx/publicaciones/CAnivANM150/L29_ANM_Guias_alimentarias.pdf. ANM, Mexico, City, Mexico, 2015.
- Nutrition Division Ministry of Health. Food Based Dietary Guidelines for Sri Lankans, 2nd ed. Published online at www.fao.org/3/a-as886e.pdf. Nutrition Division Ministry of Health, Colombo, Sri Lanka, 2011.
- Japan Dietetic Association. Japanese health and nutrition information. Published online at www.dietitian.or.jp/english/health/#. JDA, Tokyo, Japan, 2010.
- Health Canada. Canada’s Dietary Guidelines. Published online at https://food-guide.canada.ca/en/guidelines. Government of Canada, Ottawa, Canada, 2019.
- National Health and Medical Research Council. Australian Guide to Healthy Eating. Published online at www.eatforhealth.gov.au/guidelines/australian-guide-healthy-eating. NHMRC, Canberra, Australia, 2013.
- Nutrition Australia. Healthy Eating Pyramid. Published online at www.nutritionaustralia.org/national/resource/healthy-eating-pyramid. Nutrition Australia, Chifley, Australia, 2013.
- Seal, C. J., Nugent, A. P., Tee, E.-S., and Thielecke, F. Whole-grain dietary recommendations: The need for a unified global approach. Br. J. Nutr. 115:2031, 2016.
- Griffiths, T. Towards an Australian ‘daily target intake’ for wholegrains. Food Austr. 59:600, 2007.
- Griffiths, T. Developing a target for daily wholegrain intake for Australians. Food Austr. 58:431, 2006.
- GBD 2017 Risk Factor Collaborators. Global, regional, and national comparative risk assessment of 84 behavioural, environmental and occupational, and metabolic risks or clusters of risks for 195 countries and territories, 1990–2017: A systematic analysis for the Global Burden of Disease Study 2017. Lancet. DOI: https://doi.org/10.1016/S0140-6736(18)32225-6. 2018.
- Galea, L., Beck, E., Probst, Y., and Cashman, C. Whole grain intake of Australians estimated from a cross-sectional analysis of dietary intake data from the 2011-13 Australian Health Survey. Public Health Nutr. 20:2166, 2017.
- Kamar, M., Evans, C., and Hugh-Jones, S. Factors influencing adolescent whole grain intake: A theory-based qualitative study. Appetite 101:125, 2016.
- McMackin, E., Dean, M., Woodside, J., and McKinley, M. C. Whole grains and health: Attitudes to whole grains against a prevailing background of increased marketing and promotion. Public Health Nutr. 16:743, 2013.
- Ferruzzi, M. G., Jonnalagadda, S. S., Liu, S., Marquart, L., McKeown, N., et al. Developing a standard definition of whole-grain foods for dietary recommendations: Summary report of a multidisciplinary expert roundtable discussion. Adv. Nutr. 5:164, 2014.
- Aune, D., Keum, N., Giovannucci, E., Fadnes, L. T., Boffetta, P., Greenwood, D. C., Tonstad, S., Vatten, L. J., Riboli, E., and Norat, T. Whole grain consumption and risk of cardiovascular disease, cancer, and all cause and cause specific mortality: Systematic review and dose-response meta-analysis of prospective studies. BMJ. DOI: https://doi.org/10.1136/bmj.i2716. 2016.
- World Cancer Research Fund and American Institute for Cancer Research. Wholegrains, vegetables & fruit. Published online at www.wcrf.org/dietandcancer/exposures/wholegrains-veg-fruit. WCRF, London, U.K., 2018.
- Schölmerich, V. L. N., and Kawachi, I. Translating the socio-ecological perspective into multilevel interventions: Gaps between theory and practice. Health Educ. Behav. 43:17, 2016.
- Suthers, R., Broom, M., and Beck, E. J. Key characteristics of public health interventions aimed at increasing whole grain intake: A systematic review. J. Nutr. Educ. Behav. 50:813, 2018.
- Greve, C., and Iben Neess, R. The Evolution of the Whole Grain Partnership in Denmark. Copenhagen Business School and the Danish Whole Grain Partnership, Copenhagen, Denmark, 2014.
- Curtain, F., and Grafenauer, S. Health Star Rating in grain foods—Does it adequately differentiate refined and whole grain foods? Nutrients. DOI: https://doi.org/10.3390/nu11020415. 2019.
- Curtain, F., and Grafenauer, S. Comprehensive nutrition review of grain-based muesli bars in Australia: An audit of supermarket products. 8:370, 2019.
- Wellard-Cole, L., Watson, W. L., Hughes, C., and Chapman, K. How effective is food industry self-substantiation of food–health relationships underpinning health claims on food labels in Australia? Public Health Nutr. 22:1686, 2019.
- Food Standards Australia New Zealand. Australia New Zealand Food Standards Code – Standard 1.2.7 – Nutrition, Health and Related Claims. Published online at www.comlaw.gov.au/Series/F2013L00054. FSANZ, Kingston, Australia, and Wellington, New Zealand, 2016.
- Grains & Legumes Nutrition Council. Code of Practice for Whole Grain Ingredient Content Claims. Published online at www.glnc.org.au/codeofpractice. GLNC, North Sydney, Australia, 2013.
- Oldways Whole Grain Council. Whole Grain Stamp. Published online at https://wholegrainscouncil.org/whole-grain-stamp/its-working. Oldways Whole Grain Council, Boston, MA, 2020.
- Oldways Whole Grain Council. Selling more whole grain—Why the whole grain stamp is essential. Published online at https://wholegrainscouncil.org/sites/default/files/thumbnails/image/wgsurvey_ig_2015_wgsales.jpg. Oldways Whole Grain Council, Boston, MA, 2020.
- Edwards, A., Minihan, K., Shenton, S., Washington, J., and Edelstein, S. Awareness of new promotional tools for whole grains among dietitians. Topics Clin. Nutr. 23:56, 2008.
- Talati, Z., Norman, R., Kelly, B., Dixon, H., Neal, B., Miller, C., and Pettigrew, S. A randomized trial assessing the effects of health claims on choice of foods in the presence of front-of-pack labels. Am. J. Clin. Nutr. 108:1275, 2017.
- Kaur, A., Scarborough, P., and Raynor, M. A systematic review, and meta-analyses, of the impact of health-related claims on dietary choices. Int. J. Behav. Nutr. Phys. Act. 14:93, 2017.
- Steinhauser, J., Janssen, M., and Hamm, U. Consumers’ purchase decisions for products with nutrition and health claims: What role do product category and gaze duration on claims play? Appetite. DOI: https://doi.org/10.1016/j.appet.2019.104337. 2019.
- Talati, Z., Pettigrew, S., Dixon, H., Neal, B., Ball, K., and Hughes, C. Do health claims and front-of-pack labels lead to a positivity bias in unhealthy foods? Nutrients 8:787, 2016.
- Commonwealth of Australia. About Health Star Ratings. Published online at http://healthstarrating.gov.au/internet/healthstarrating/publishing.nsf/Content/About-health-stars. Commonwealth of Australia, Canberra, Australia, 2019.
- Jones, A., Rådholm, K., and Neal, B. Defining ‘unhealthy’: A systematic analysis of alignment between the Australian Dietary Guidelines and the Health Star Rating system. Nutrients 10:501, 2018.
- mpconsulting. Health Star Rating system five year review report. Published online at www.healthstarrating.gov.au/internet/healthstarrating/publishing.nsf/Content/D1562AA78A574853CA2581BD00828751/$File/Health-Star-Rating-System-Five-Year-Review-Report.pdf. Commonwealth of Australia, Canberra, Australia, 2019.
- De Moura, F. F., Lewis, K. D., and Falk, M. C. Applying the FDA definition of whole grains to the evidence for cardiovascular disease health claims. J. Nutr. 139:2220S, 2009.
- Kanter, R., Vanderlee, L., and Vandevijvere, S. Front-of-package nutrition labelling policy: Global progress and future directions. Public Health Nutr. 21:1399, 2018.
- Department of Health, Foods Standards Agency, and Administrations in Scotland, Northern Ireland, and Wales. Guide to creating a front of pack (FoP) nutrition label for pre-packed products sold through retail outlets. Published online at www.food.gov.uk/sites/default/files/media/document/fop-guidance_0.pdf. Food Standards Agency, London, U.K., 2016.
- Colruyt Group. What is the Nutri-Score? Published online at https://nutriscore.colruytgroup.com/colruytgroup/en/about-nutri-score. Colruyt Group, Halle, Belgium, 2020.
- van der Bend, D. L. M., and Lissner, L. Differences and similarities between front-of-pack nutrition labels in Europe: A comparison of functional and visual aspects. Nutrients. DOI: https://doi.org/10.3390/nu11030626. 2019.
- Health Promotion Board. Healthier Choice symbol nutrient guidelines. Published online at www.hpb.gov.sg/docs/default-source/default-document-library/hcs-guidelines-(january-2018)9ab599f6468366dea7adff00000d8c5a.pdf?sfvrsn=2d36ff72_0. Health Promotion Board, Singapore, 2018.
|